Introduction
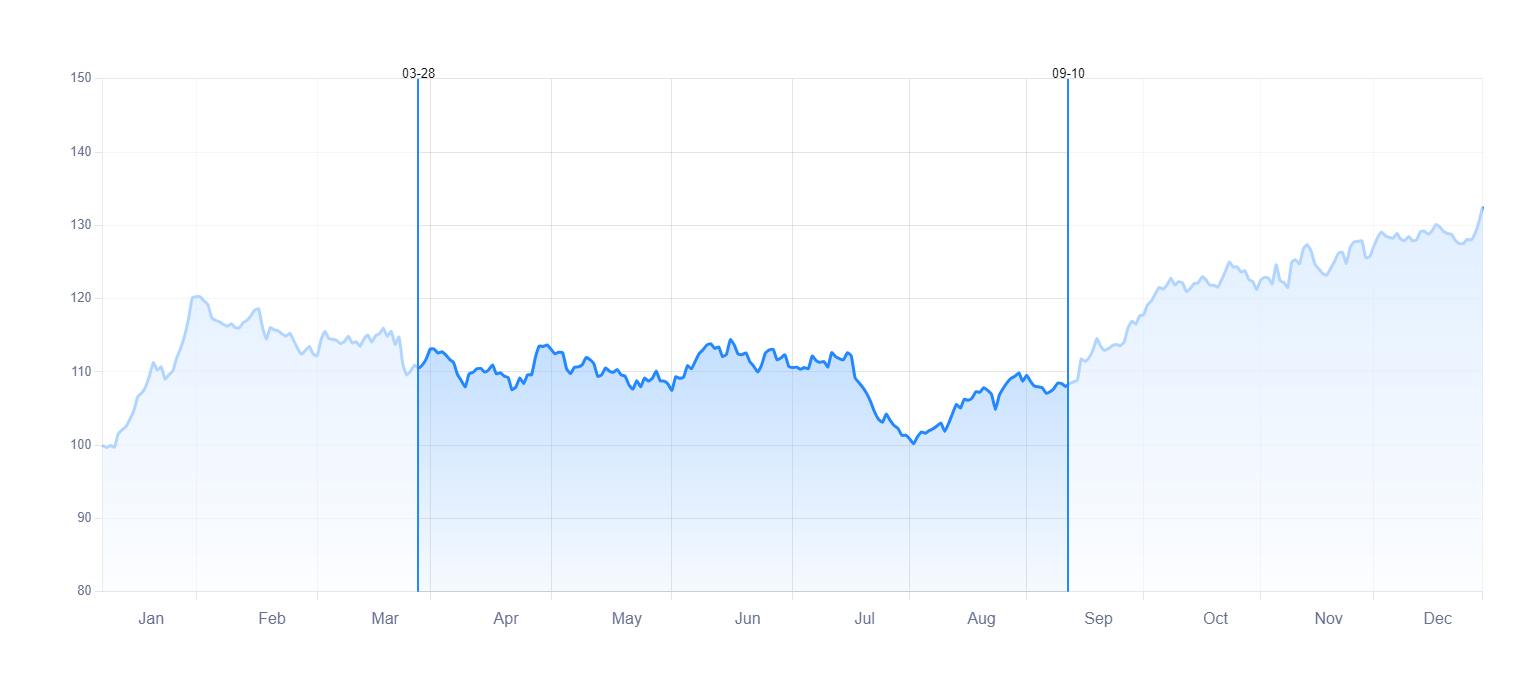
This is a ChartJS selection range plugin for line charts. Selects a range of the chart from the X-axis. You can visually select the desired range on the chart using the mouse and the draggable feature.
It is also possible to display it on the chart by selecting the desired interval with numerical data and using the method available in the plugin. This is a ChartJS selection range plugin for line charts. Selects a range of the chart from the X-axis. You can visually select the desired range on the chart using the mouse and the draggable feature.
Installation
Run the following command in the path of the project folder
npm install chartjs-plugin-draggable-selectrange
OR Use cdn:
https:/gh/mohamadhpp/chartjs-plugin-draggable-select-range@master/src/index.min.js
Usage
Import the plugin on the desired page using the line below.
import draggableSelectRangePlugin from 'chartjs-plugin-draggable-selectrange';
Then you can register the plugin in Chart.js using the following code.
Chart.register(draggableSelectRangePlugin);
Then we use it in the codes as follows.
plugins:
{
    draggableSelectRange:
    {
        enable: true,

        text:
        {
            enable: true,

            offset: -15,
            padding: 1
        },

        onSelectComplete: (event) =>
        {
            // Print start & end data range
            console.log(event.range[0])
            console.log(event.range[1])
        }
    }
}
Configuration
The properties of the plugin are as follows:
| option | type | default | description |
|---|---|---|---|
| enable | bool | false | Specifies the current state of the plugin |
| unselectColor | string | rgba(255,255,255,0.65) | Using this you can choose a specific color for the parts that are not selected so that only the selected part is visible |
| borderColor | string | #2388FF | Choose a color for the line separating the selected and unselected part |
| borderWidth | number | 2 | For the dividing line between selected and unselected parts, we select Width based on pixels |
| startDataIndex | object | undefined | This is an object that represents the starting index values of the data in the selected range. It also includes other values related to the index |
| endDataIndex | object | undefined | This is an object that shows the end index values of the data in the selected range. It also includes other values related to the index |
| text | object | --- | Contains data related to the text of the selected interval on the separator line |
| text.enable | bool | true | If this valu e is true, the text will be displayed |
| text.color | string | #000 | Specifies the color of the text |
| text.offset | number | 0 | The distance of the text is from right and left |
| text.padding | number | 0 | The padding of the text is from the right and left |
| text.font | object | --- | You can change the font and size of the text |
| text.font.family | string | Arial | Its value includes the font family of the text |
| text.font.size | number | 13 | The value includes the text size |
Apis
The plugin methods are as follows:
| method | param | description |
|---|---|---|
| clearDraw | chart | Using this method, you can clear the selected range on the chart. The input value of this method is chart, which is the same as the chart element. |
| setRange | chartoptionsrange | With this method, the desired range can be selected on the chart. The chart value of the created chart element, the options of the plugin configuration and the range value of a list containing 2 elements, the first element of the starting point data and the second element of the end point data. |
Event
In this plugin, there is only one event, and it is for the time of choosing the desired interval.
| option | param | description |
|---|---|---|
| onSelect | event | This event is for choosing the interval on the chart. The event parameter has 2 values boundingBox and range. The boundingBox value contains the information of the coordinates of the selected range and the range value contains the selected data range whose length is 2. The value of range[0] is equal to the data of the start range and the value of range[1] is equal to the data of the end range. |
Example & Demo
In the example folder, there is a example to explain the plugin. The demo version is also available online in the link below.
Show online demo: Online Demo